Linear Regression Curve
Moving averages have been used by traders around the world due to its capacity to provide information about emerging new trends or consolidated ones.Traders use this tool, because it works as a filter showing a smoother representation of price. Almost every trader uses or has used moving averages as a trading technique basis.
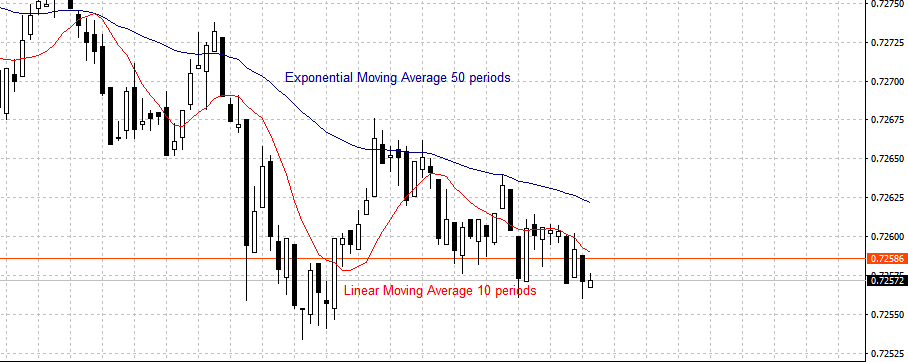
Figure 1
As you can see in the figure above, the greater the number of periods used,the smoother the price, filtering the most part of noise present in the price.
One of the most basic yet powerful trading techniques are those based on the moving averages crossover. Using two moving averages one with a shorter period than the other and analyzing the crossover of them, we can establish inflexion points generating clear buy or sell signals. An example is showed in the graph above where we can observe a cross point at the very beginning part of the graph showing a possible sell signal.
You may ask yourself “why isn’t everyone making money easily with this technique?”. The problem with the moving averages is that they give us valid trading signals, but delayed. By the time the signal is generated, the price has been moving in that direction for some time, resulting in potential profit loss. This is the main reason why using moving linear regression can be an advantage over moving averages.
http://epchan.blogspot.com.es/2011/04/many-facets-of-linear-regression.html
Linear Regression Curve Concept
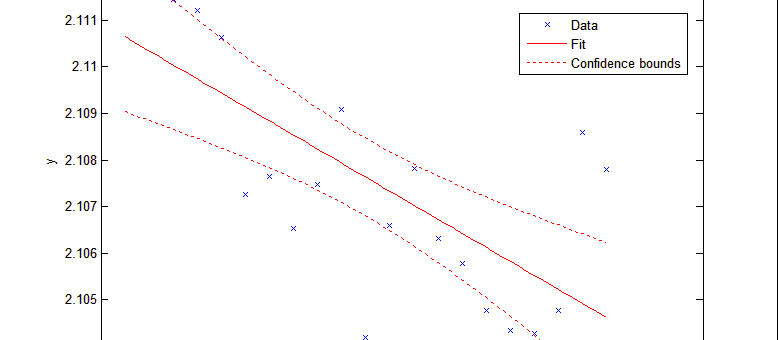
Explained in simple terms, Linear regression line is a mathematical concept where given a points cloud we can calculate the best fit line which best describes the relationship between them in terms of least squares. Let’s see with an a self explanatory example generated with R.
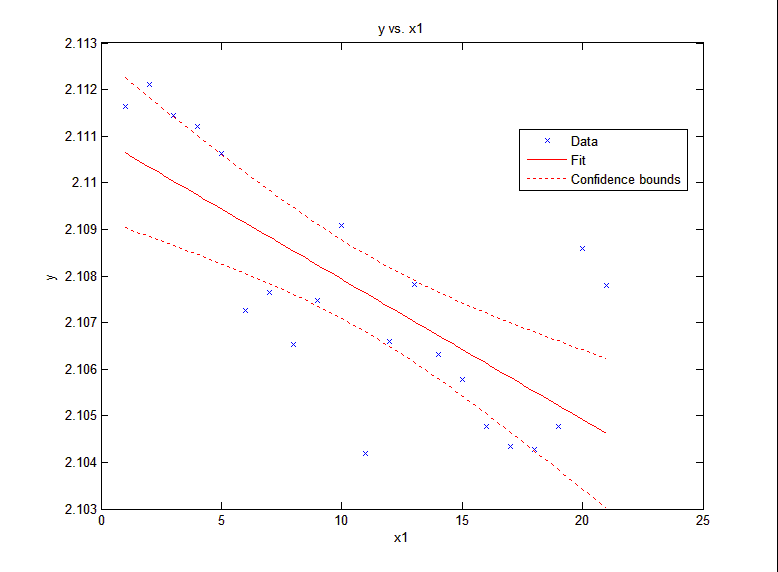
Figure 2
But what has this to do with the moving averages and in what sense is better for studying the price signal?.
Linear regression curves are able to adapt better to price movement changes in terms of fidelity with the original price shape while preserving the filter capacity.
In order to get the linear regression curve at any point we have to calculate the simple regression line as shown above for the last n points, getting only the most recent one as a result for the given point. The process is repeated for every point.
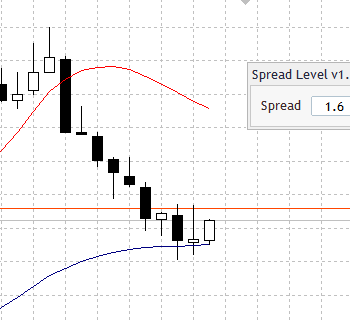
As is showed in the following graph linear regression curve respond quicker to price movements while maintaining the filter capacity.

Figure 3
Pay attention to the lack of fidelity of the exponential moving average (EMA) with respect to the original price shape. The price is smoothed at the expenses of price movement details loss. Even by using a lower period EMA, we are far away of describing the price correctly.
On the other hand, by using LRC we are going to be able to describe the price better in terms of fidelity with respect to the original price shape, responding faster, while maintain a filter capacity comparable with EMA. What´s an advantage over the EMA!. Now going back to the moving average crossing strategy shown earlier and using LRC instead of EMA or SMA we are now going to be able to generate buy or sell signals quicker, capturing the start of a new trend from the very beginning.
As an example a LRC crossover strategy is presented, showing clearly buy/sell signals in the crossing points. The potential profits have now risen with no drawbacks.
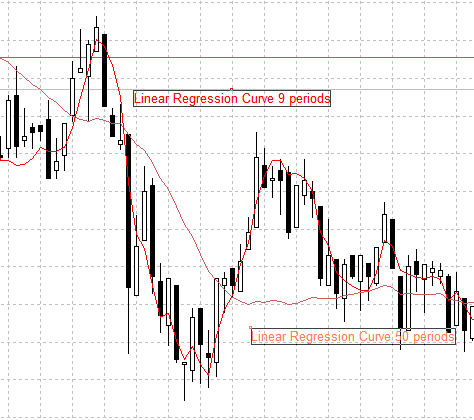
Figure 4
I have developed a metatrader indicator which implement the algorithm described above, use it your own way to develop your strategies. The only input parameters is, as usual with EMA/SMA, the number of periods used.
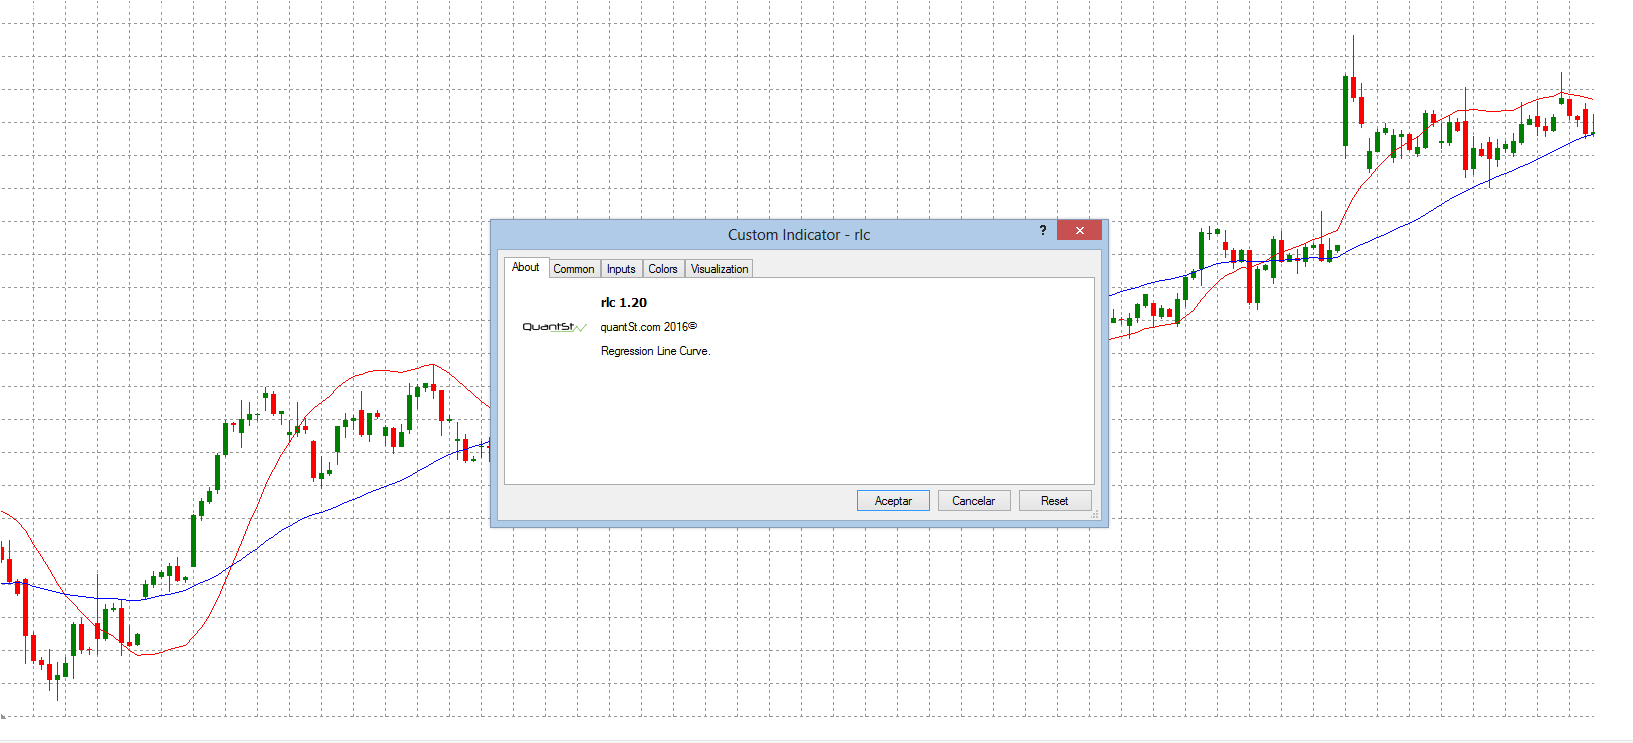
Figure 5
Reference: Article in gekkoquant.
1 Comments