Kelly Criterion
Money management is sometimes forgotten by some traders, nevertheless carry on a good money risk management is the key in order to obtain success in the long term. In this article I’m going to show you one of the most important and well-known technique, the so called Kelly Criterion, used by many traders around the world to manage their risk properly, in order to establish an optimal risk balance.
A brief history
John kelly who worked for At&T Bell laboratory was the original developer of the kelly criterion, mainly developed to deal with the noisy long length lines. You can access the original paper in this link. Afterwards many people found his studies interesting and his work was applied to other fields like gambling and of course financial world.
In order to apply the Kelly Criterion we have to be familiar with two fundamental concepts,
- Probability to get win trades [W]
- The ratio between win and lose trades [R]
Kelly [%] = W – [(1-W)/R]
Figure 1
The result of the kelly criterion formula is a percentage that serves to determine the fraction of our funds we should risk to maximize risk-benefit ratio in the long term .
Let’s see it with the following example,
Consider that we have a strategy for a given financial instrument , in this example, the forex pair EUR/USD. If we take the last trades, We can get the term W by dividing the total winning trades between n, the term R result of dividing the average gain in winning trades between the average loss on the losers trades. We obtain a value between 0 and 1 introducing these data into the formula. This value should be interpreted as the percentage limit of our funds we should risk.
How to interpret this results?
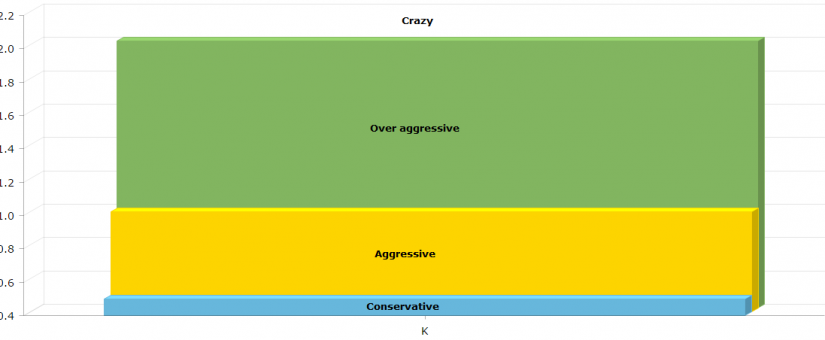
We should be aware that as a general rule half the value calculated in the formula is taken as a reference for a conservative value. According to our investment policy either aggressive or conservative we should take the right value. The graph below is showing the relationship between the kelly criterion multiple and the associated risk.
Figure 2
As we can see in the graph above, a value between 0 and K/2 are considered a conservative one, on the other hand a value between K/2 and K are normally considered an aggressive one. It is advised not to invest over the full kelly criterion value in order to keep a reasonable risk-benefit ratio. Half kelly value is accepted as the reference value.
I have developed a simple yet powerful Metatrader Indicator to get a quick assessment of our strategies.
As soon as we insert the indicator into the instrument we starting to get information related with our trades, winning trades balance, the average winning / losing trades and the value for the full and the half kelly. All information is automatically generated based on the information in the account history for the current instrument.
The indicator has 3 configurable parameters,
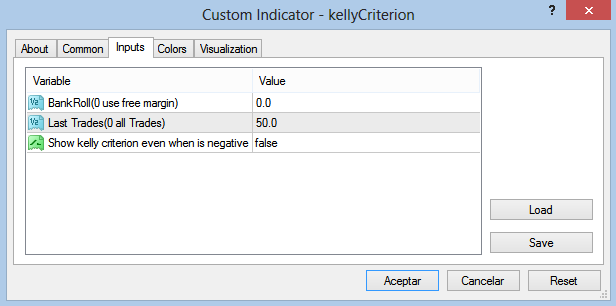
Figure 3
With the Bankrool parameter we can set the amount of money we have available to make trades, if we left this parameter blank the indicator will use the free margin available.
Setting the second parameter, ‘Last trades’, we are indicating the number of last trades used to do the calculations, it is recommended to use, at least, 50-70 trades in order to get a reliable results. If we left this parameter blank all the trades available in history for the instrument under study will be used to do the calculations.
With the third parameter we can force to present a result even when we get a negative one. As a rule of thumb a kelly criterion negative value is a pretty good indicator of a low quality strategy. Although there may be circumstances that make interesting to know this parameter , for example if we have a strategy with a very negative value we can evaluate the idea of invert the strategy, but we need to be aware about what part of losses is related with broker commissions.
Once the parameters are setted, the window below is presented,
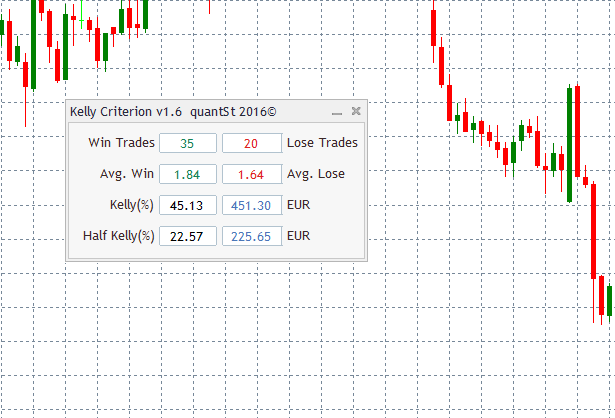
Figure 4
All the values are changing dynamically in real time, according with our success in the last trades.

0 Comments